KPI and Benchmarking Part 1 of 2

First off, you may be asking what are KPI’s, Benchmarking, and Dashboards?
Secondly, you may be asking how will they help me?
KPI is the acronym for Key Performance Indicator and they should immediately tell you what’s right and what’s wrong with your business areas and most of all your productivity and profits. In other words, you can tell the health and well-being of your organization from 1,000 miles away!
There are lots and lots of important measurements, but they are not necessarily KEY performance measurements (KPI’s). KPI’s are the foundation upon which meaningful reporting happens. Without KPI’s you cannot have Benchmarking nor any meaningful Dashboards. What is deemed important often depends on the department measuring the performance (e.g. the KPI’s useful to finance will differ from the KPI’s assigned to sales).
* WIKIPEDIA*
KPI’s should follow the SMART criteria. This means the measure has a Specific purpose for the business, it is Measurable to really get a value of the KPI, the defined norms have to be Achievable, the improvement of a KPI has to be Relevant to the success of the organization, and finally it must be Time phased, which means the value or outcomes are shown for a predefined and relevant period. In order to be evaluated, KPI’s are linked to target values, so that the value of the measurement can be assessed as meeting expectations or not.
We will discuss in part #2 the what, when, and how of Benchmarking and Dashboards as well as how to view them as a predictive tool.
However, let’s start at the beginning. The following is a minimum list of KPI’s for Supply Chain Management.
Typically Accepted KPI’s (for Supply Chain Management)
Purchasing
- Number of Sole Source Suppliers.
- Number of Approved Suppliers.
- Supplier Status/Relationship.
- Critical.
- Essential.
- Normal.
- Average cost to cut a PO.
- Supplier Status.
- Late Deliveries.
- Number of rejects per thousand parts.
- Annual Dollars Spent.
- Supplies.
- Direct Turn Over (DTO) Materials.
- Capital Equipment.
- Services.
Inventory
- Dollars in Inventory.
- Raw Materials.
- Work In Progress (WIP).
- Finished Goods.
- Inventory Turnover.
- Total Inventory.
- By ABC Classification.
- ABC Classification by SKU (Pareto Analysis).
- Identification and Valuation of Excess and Obsolete Materials.
- Average (quantity) Days on Hand.
- Total number of SKU’s.
- Description and Unit of Measure.
- Net and Gross Inventory Adjustments (Inventory Accuracy).
- Daily.
- Monthly.
- Quarterly.
- Annually.
Receiving
- Number of SKU’s (Dock to Stock).
- Number of SKU’s received per day.
- Number of SKU’s Received per Receiving Employee.
- Number of PO’s in Quarantine/Material Review Board (MRB).
- Number of SKU’s in Quarantine/Material Review Board (MRB).
- Days in Quarantine per SKU.
- Backlog of SKU’s.
- Backlog of PO’s.
- Overtime hours month to date.
Warehousing
- Number of Warehouse Employees.
- Stock Location Methodology.
- Number of SKU’s.
- Number of SKU’s in Zone A.
- Identification and Segregation of Excess and Obsolete Materials.
- Transactions per Employee.
- Warehouse Capacity.
- Actual Warehouse Population vs. Capacity.
- Warehouse Square Footage.
- Number of Back Orders.
- Overtime hours month to date.
Shipping
- Percent on time shipped.
- Number of expedited shipments.
- Number of Core/Approved Carriers.
- Core Carrier Discount Rates.
- Freight Savings.
- Month to date.
- Year to date.
- Annual Savings.
- Inbound/Outbound Routing Guide.
- Number of Freight Claims and Associated Dollars.
- Number of Receipts of Rejects.
- Overtime hours month to date.
Customer Service
- Percent Customer Satisfaction.
- Number of Customer Complaints.
- Number and Types of Returns.
- Number of Incoming Calls per Employee.
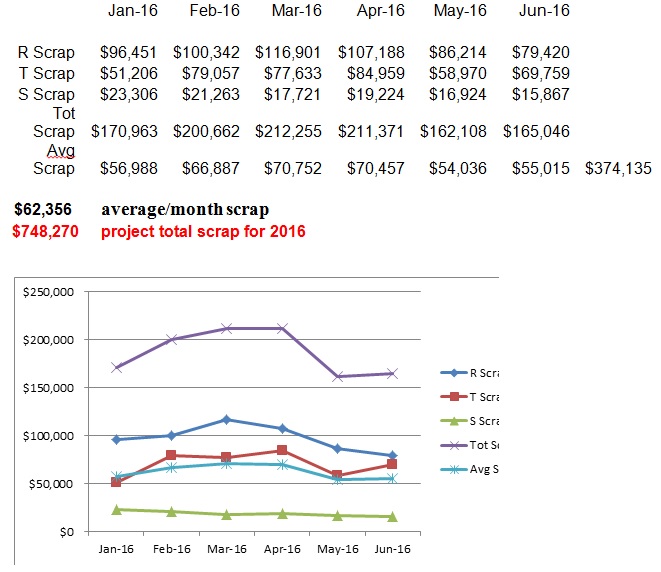
When the same KPI’s are plotted in a graph over time it clearly defines a trend and this trend can easily predict the outcome and a median, or average, can be struck that, once again, is used in Benchmarking. Looking at the following simple example we can draw some significant conclusions. Remember, if you don’t measure it you can’t manage it.

Therefore you can now evaluate the situation and decide if losing ¾ of a million dollars is unacceptable, but you have the opportunity to adjust/correct it. However, without KPI’s you would never even know how bad the situation is.
Your path to business success.

